-
Improvement
-
Resolution: Fixed
-
 Minor
Minor
-
4.1
-
MOODLE_401_STABLE
-
MOODLE_401_STABLE
-
MDL-74960-master -
The performance info (displayed at bottom of the page if enabled in admin settings) shows lots of useful information which can identify performance problems in production as well as test sites, such as too many database queries or incorrect cache usage.
At present it does not show any information about waiting for locks. For example, while investigating a reported performance issue here I saw that a page sometimes took 38 seconds to load, with 1.5 seconds on database queries and nothing interesting in the cache area. It was not immediately obvious that the other 36.5 seconds was spent waiting for the course modinfo lock. (In this scenario, another user's request was actually building modinfo, and my request was waiting for theirs to complete, but once completed, it didn't have to build the cache.)
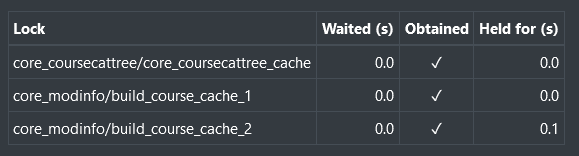
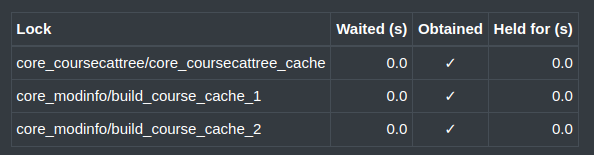
I propose we add a table below the cache table, listing each lock used by the page (in the order they were requested), with:
- The time taken to acquire (or fail to acquire) the lock.
- Whether it was acquired or not.
- The time that the lock was held before being released.

- caused a regression
-
MDL-76506 Lock Factory and Application Cache incorrectly always enables performance debugging
-
- Closed
-
