Discovered while testing MDLQA-14519 (setp 22).
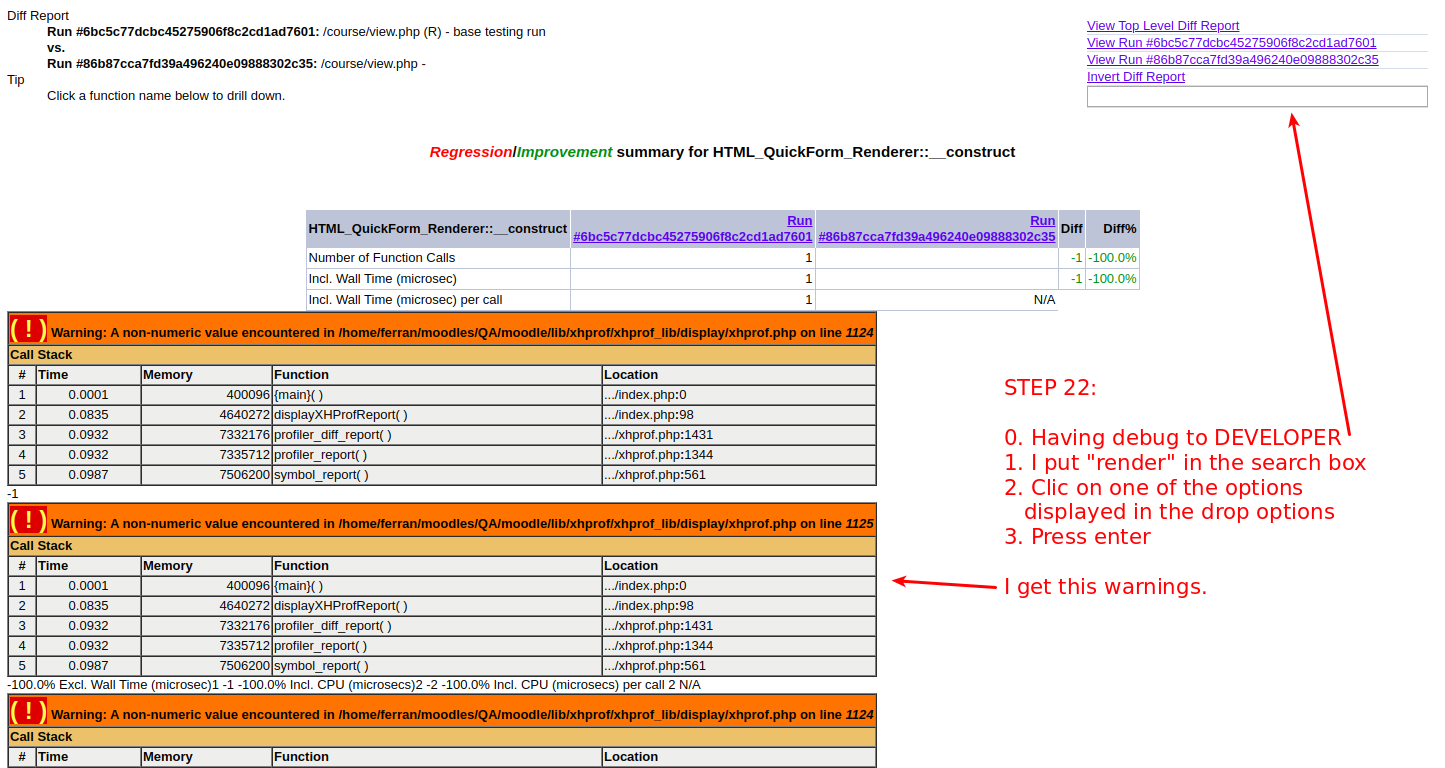
The warning message is:
Warning: A non-numeric value encountered in /home/ferran/moodles/QA/moodle/lib/xhprof/xhprof_lib/display/xhprof.php on line 1124
The code line is:
print_td_num($avg_info2 - $avg_info1, $format_cbk[$m], true); |
The problem is in "$avg_info2 - $avg_info1" because sometimes one of the two variables can be a string with value "N/A" instead of an integer.
It's hard to reproduce because it only happens with some diffs. As far as I can detect it only happens when all the diff statistics are all in green (but I cannot guarantee this is the motive).
0) Pre-requisites:
- To have the xhprof or tideways php extension installed and available.
- To have the "dot" executable available.
1) Add this to your instance config.php:
$CFG->debug = 32767; |
$CFG->earlyprofilingenabled = true; |
$CFG->profilingenabled=true; |
$CFG->profilingautofrec = 5; |
$CFG->profilingincluded = '/*view.php,/*index.php'; |
$CFG->profilingallowme = true; |
$CFG->profilingallowall = true; |
$CFG->pathtodot = '/path/to/your/executable/dot'; |
2) As admin go to a course view and add "&PROFILEME" to the url to profile this page.
- Check that in the footer appears the text "This script has been profiled"
3) Refresh the course view with PROFILEME several times (>20) to have some profiling.
4) When you have refresh the page several times, go to "site administration -> development -> profiling runs"
5) Click on the "arrow" icon of one of the /course/view.php entries
6) In the table of course/view.php runs, click on the date of the entry which has the max Execution time, CPU time, Function calls, and Memory used.
7) In the summary page of that profile run, put a tick on "Mark as reference run/comment", set the text field "base testing run" and click on "Save changes button".
8) On the breadcrumb, click on the last element ("/course/view.php")
9) Again on the profiles runs of "course/view.php" click on the date of one of the most recent entries.
10) If any of the Execution times, CPU time, Function calls or Memory used are in red, try another profile run (I can only reproduce when all statistics are in green.) 
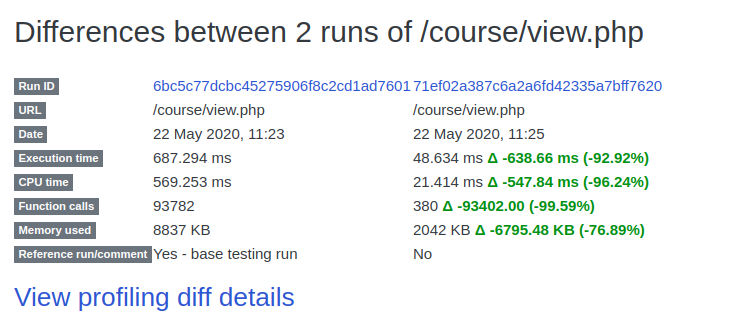
10) In the "View profiling differences with" table click on the link in the "Run ID" column.
11) Now you are on "Differences between 2 runs of /course/view.php", click on the "View profiling diff details"
12) On the filter field on the top right, type "render" amb press enter.
13) If the warnings appear save this url for testing because is quite difficult to reproduce. If not, try another profile run.
When using the option "View profiling differences with -> View profiling diff details"
- Discovered while testing
-
 MDLQA-14519
CLONE - XHProf can be used for profiling
MDLQA-14519
CLONE - XHProf can be used for profiling
-

- Passed
-