Uploaded image for project: 'Moodle'
  1. Moodle
  2. MDL-68329

Improve the cache performance footer info even more

XMLWordPrintable

    • MOODLE_39_STABLE
    • MOODLE_39_STABLE
    • MDL-68329-cache-info
    • Hide

      1) /cache/admin.php Setup some cache stores, including some primary / secondary caches, eg localizable caches like course mod info

      2) Turn on the perfdebug

      3) Clear caches, look at the footer info and confirm everything lines up and looks good. 

      4) Confirm that the individual primary / secondary cache stores re visible rather than the cache store class name. NOTE: only cache stores that get a read will be shown, so a second / final store may not be shown if there was no misses on the primary cache.

      5) Confirm how it is now visible that cache misses on a higher cache (eg static) flow down to the primary and then secondary etc cache stores

      Show
      1) /cache/admin.php Setup some cache stores, including some primary / secondary caches, eg localizable caches like course mod info 2) Turn on the perfdebug 3) Clear caches, look at the footer info and confirm everything lines up and looks good.  4) Confirm that the individual primary / secondary cache stores re visible rather than the cache store class name. NOTE: only cache stores that get a read will be shown, so a second / final store may not be shown if there was no misses on the primary cache. 5) Confirm how it is now visible that cache misses on a higher cache (eg static) flow down to the primary and then secondary etc cache stores

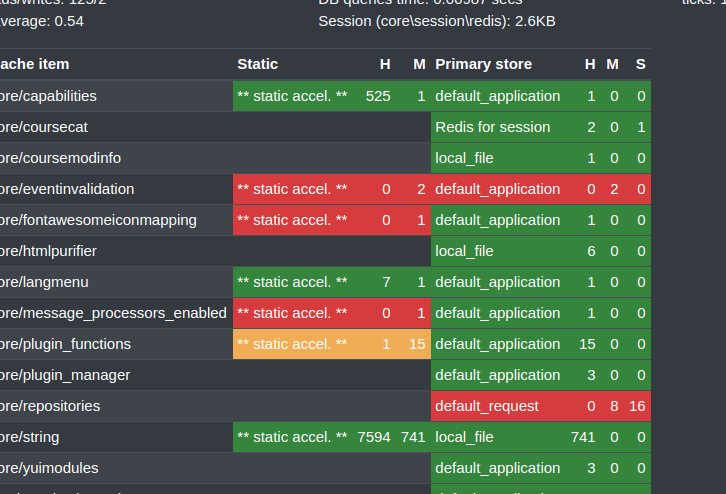
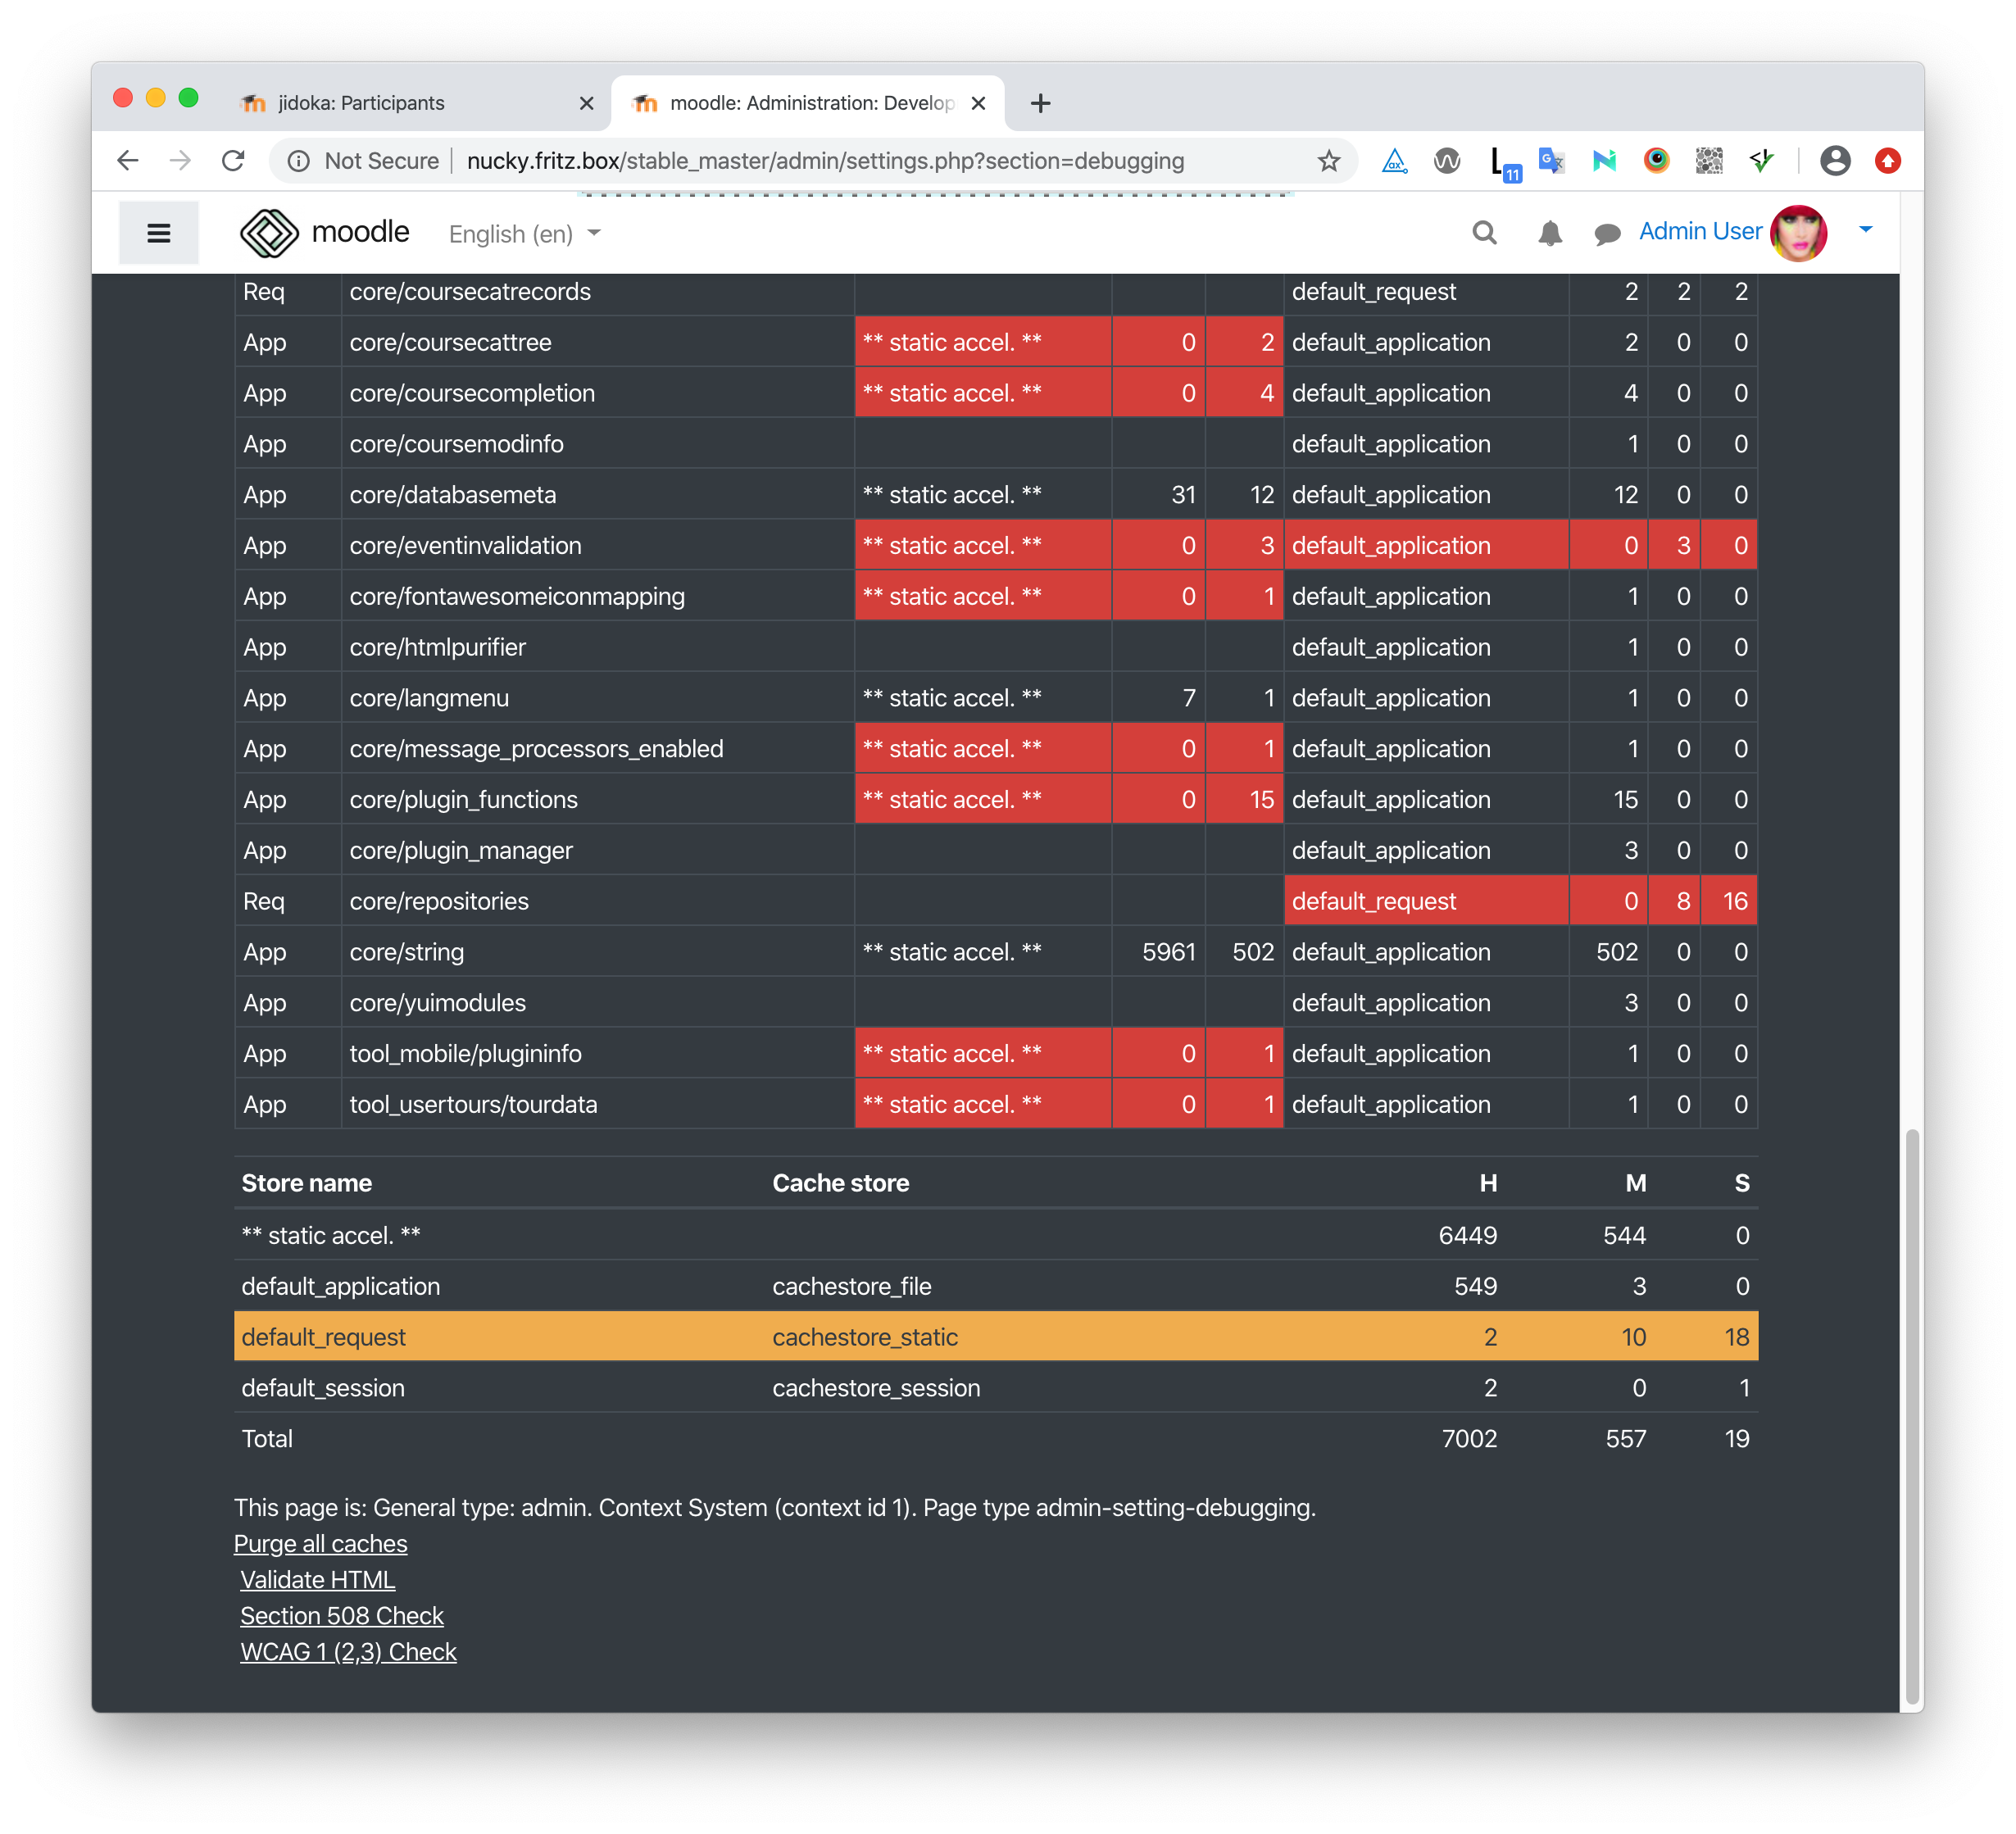
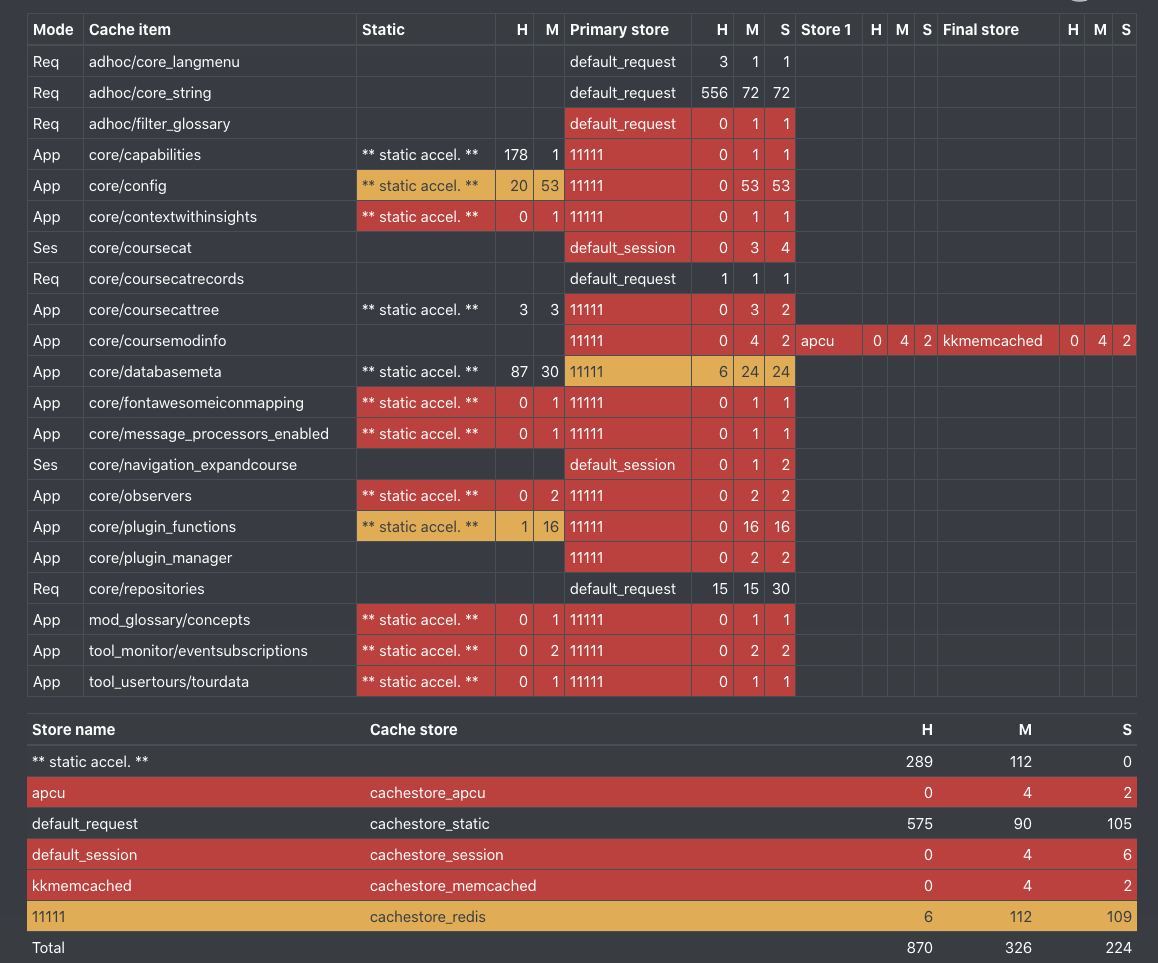
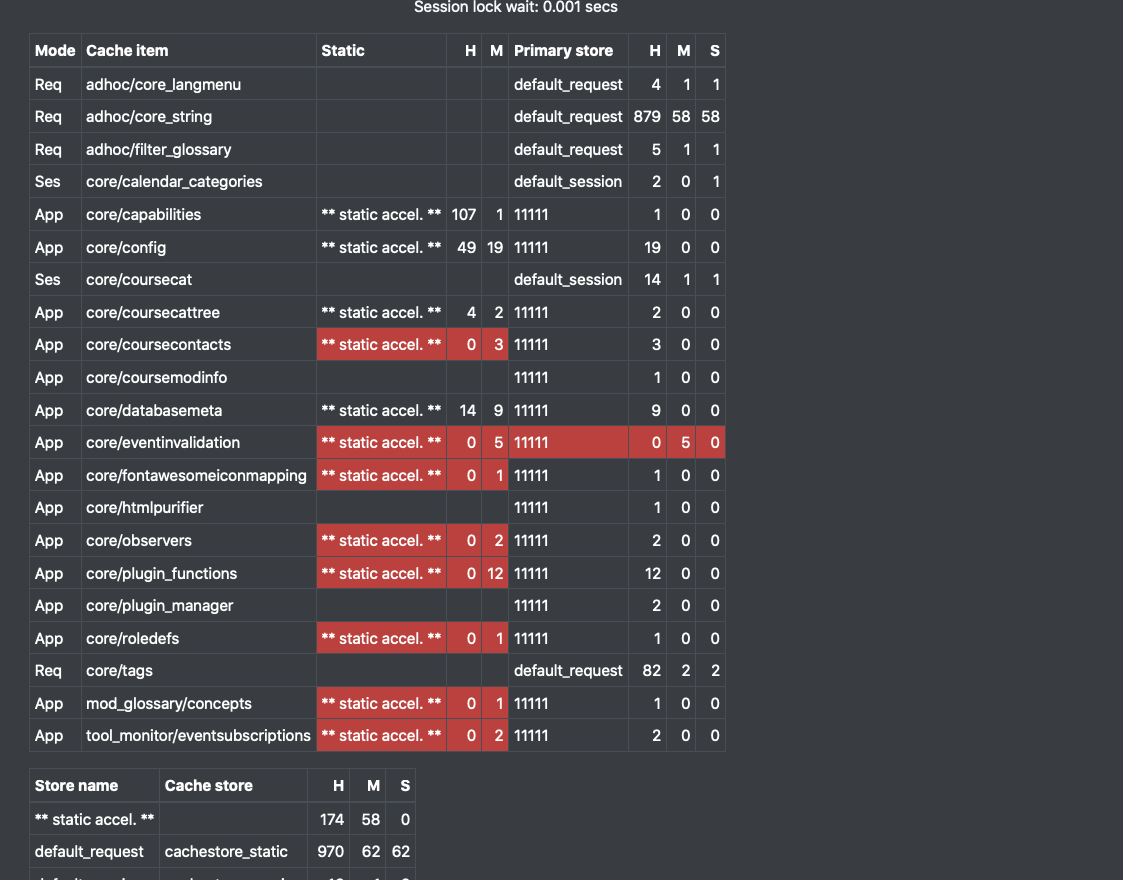
      There are a few keys bit of info I want to see:

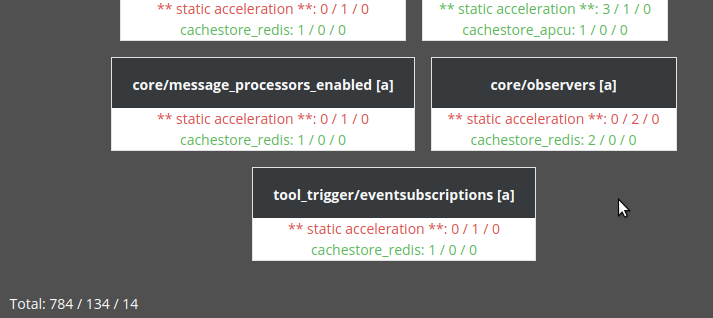
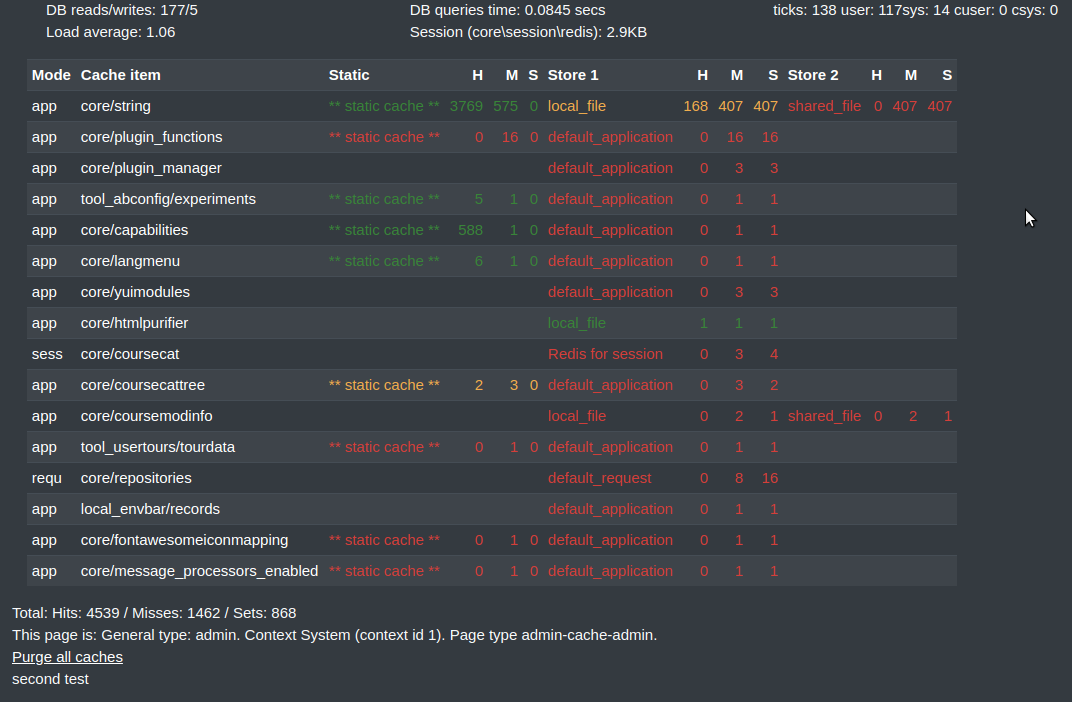
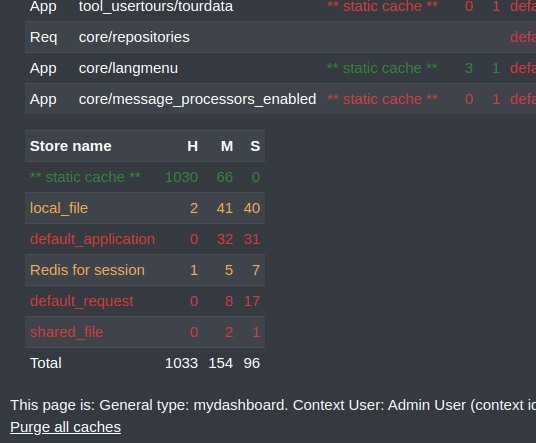
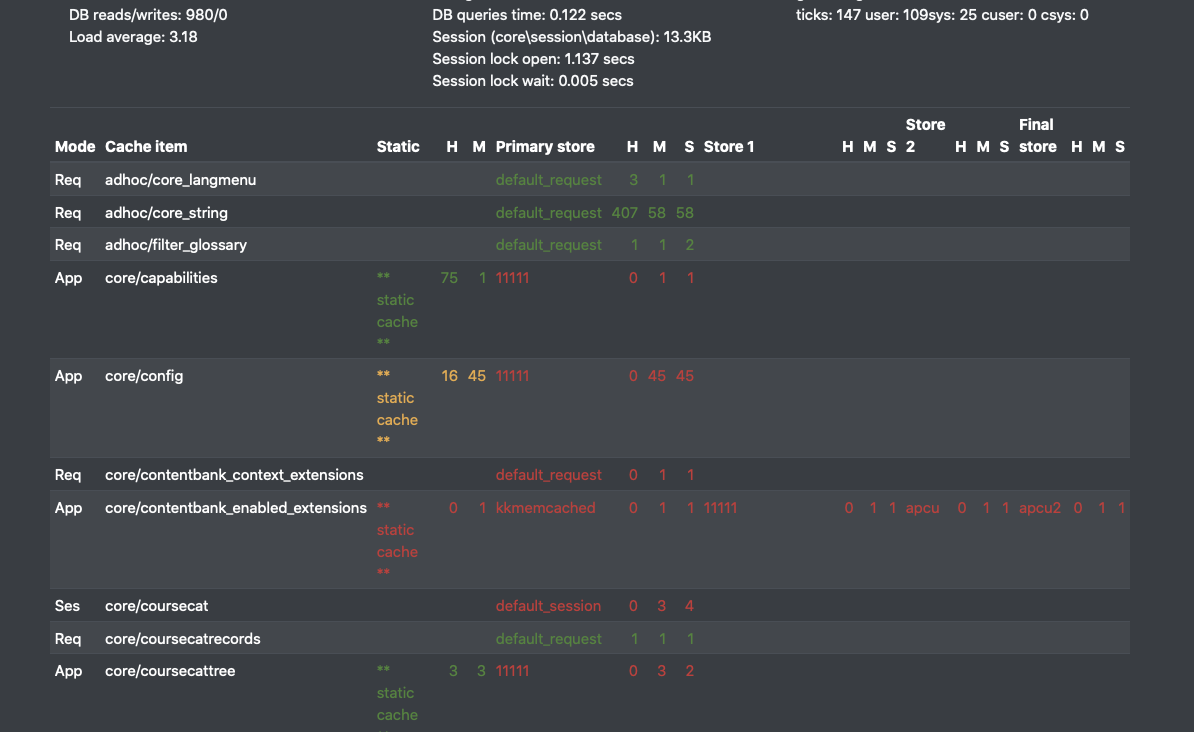
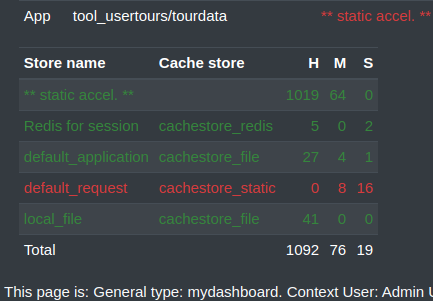
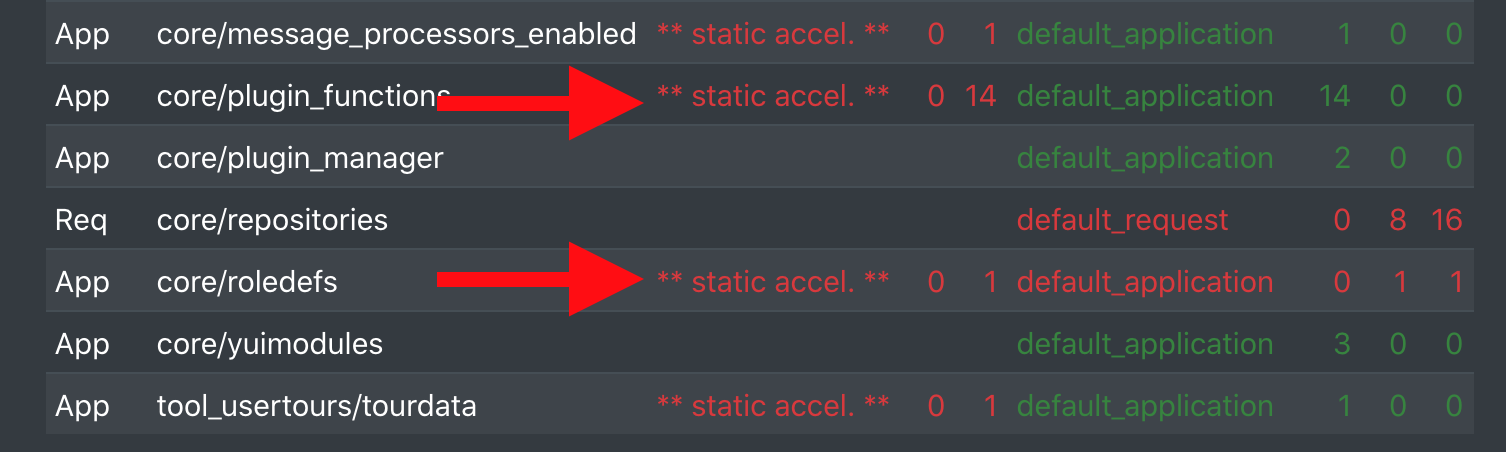
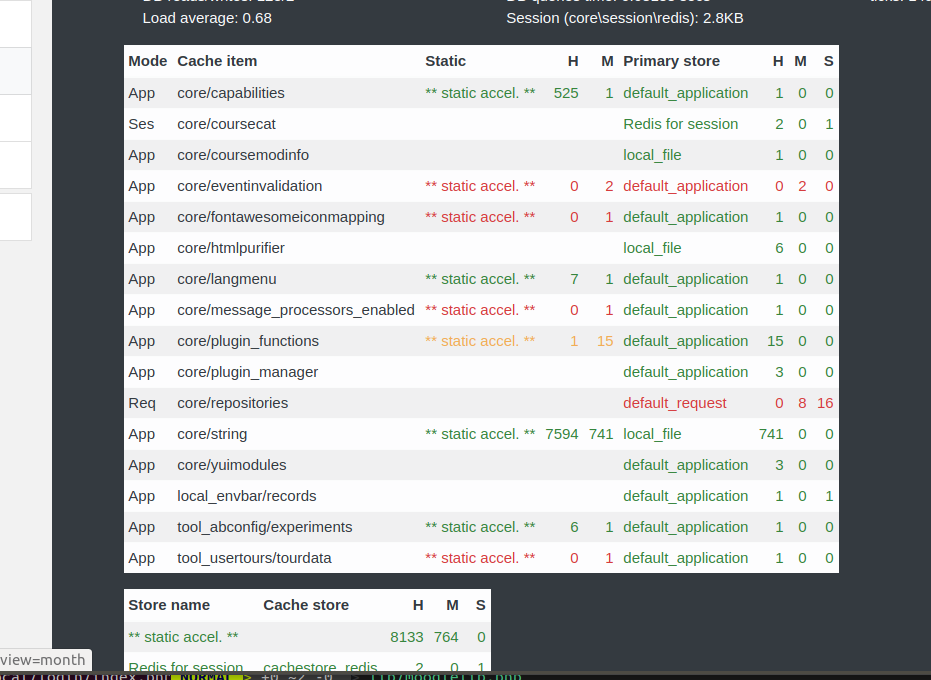
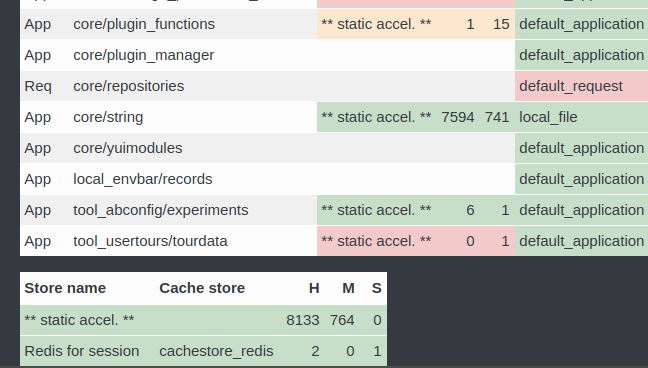
      1) Each cache def shows that cache store plugins where used, but I want to see what cache store instances were used. ie you might have 2 file caches or 2 redis caches.

      2) We get mini totals for each cache def, and a total for the lot, but we don't get a breakdown for each instance which is what I really want to see. For instance on this page there are 134 cache misses which looks like an issue to address, but they are all static cache misses so that's just fine.

      Also I think the display formatting could do with some love, it's fairly hard to parse quickly


        1. image-2020-04-03-13-47-52-259.png
          35 kB
          Brendan Heywood
        2. image-2020-04-07-22-57-26-364.png
          109 kB
          Brendan Heywood
        3. image-2020-04-15-13-42-49-800.png
          39 kB
          Brendan Heywood
        4. too_many_stores.png
          123 kB
          Eloy Lafuente (stronk7)
        5. image-2020-04-28-09-29-30-145.png
          26 kB
          Brendan Heywood
        6. what_does_this_say.png
          126 kB
          Andrew Lyons
        7. image-2020-04-29-17-24-25-633.png
          110 kB
          Brendan Heywood
        8. image-2020-04-29-22-21-44-668.png
          48 kB
          Brendan Heywood
        9. image-2020-04-29-22-21-52-189.png
          73 kB
          Brendan Heywood
        10. image-2020-04-30-00-31-34-619.png
          33 kB
          Brendan Heywood
        11. image-2020-04-29-17-28-51-867.png
          1.10 MB
          Bas Brands
        12. Screenshot 2020-04-29 at 17.08.13.png
          1.10 MB
          Bas Brands
        13. with_three_stores.png
          196 kB
          Eloy Lafuente (stronk7)
        14. good_enough.png
          183 kB
          Eloy Lafuente (stronk7)
        15. good_enough-1.png
          183 kB
          Eloy Lafuente (stronk7)

            brendanheywood Brendan Heywood
            brendanheywood Brendan Heywood
            Peter Burnett Peter Burnett
            Eloy Lafuente (stronk7) Eloy Lafuente (stronk7)
            Eloy Lafuente (stronk7) Eloy Lafuente (stronk7)
            Votes:
            2 Vote for this issue
            Watchers:
            9 Start watching this issue

              Created:
              Updated:
              Resolved:

                Estimated:
                Original Estimate - Not Specified
                Not Specified
                Remaining:
                Remaining Estimate - 0 minutes
                0m
                Logged:
                Time Spent - 5 hours, 11 minutes
                5h 11m

                  Error rendering 'clockify-timesheets-time-tracking-reports:timer-sidebar'. Please contact your Jira administrators.