Hi,
the numbers in the Course Activity Report (report_outline) only give an absolute numbers of views based on the log entries which reach back to the maximum log lifetime.
Unfortunately, a teacher does not get any clue how / if views changed over time.
For example, we have a Moodle installation with a very long log filetime and a course on this Moodle installation has run for several months now. If a teacher looks at the report, he can't really tell when the activities were accessed (especially if they were accessed directly when they were presented in class or only directly before the exams take place), he only sees the total numbers for the whole course lifetime.
I would propose to add a new column to the report which contains a trend chart for each activity which give an impression when the views of the activities happened, similar to the trend charts of Github repos on a Github profile page (e.g. https://github.com/moodle). Here's a mockup of the new feature:
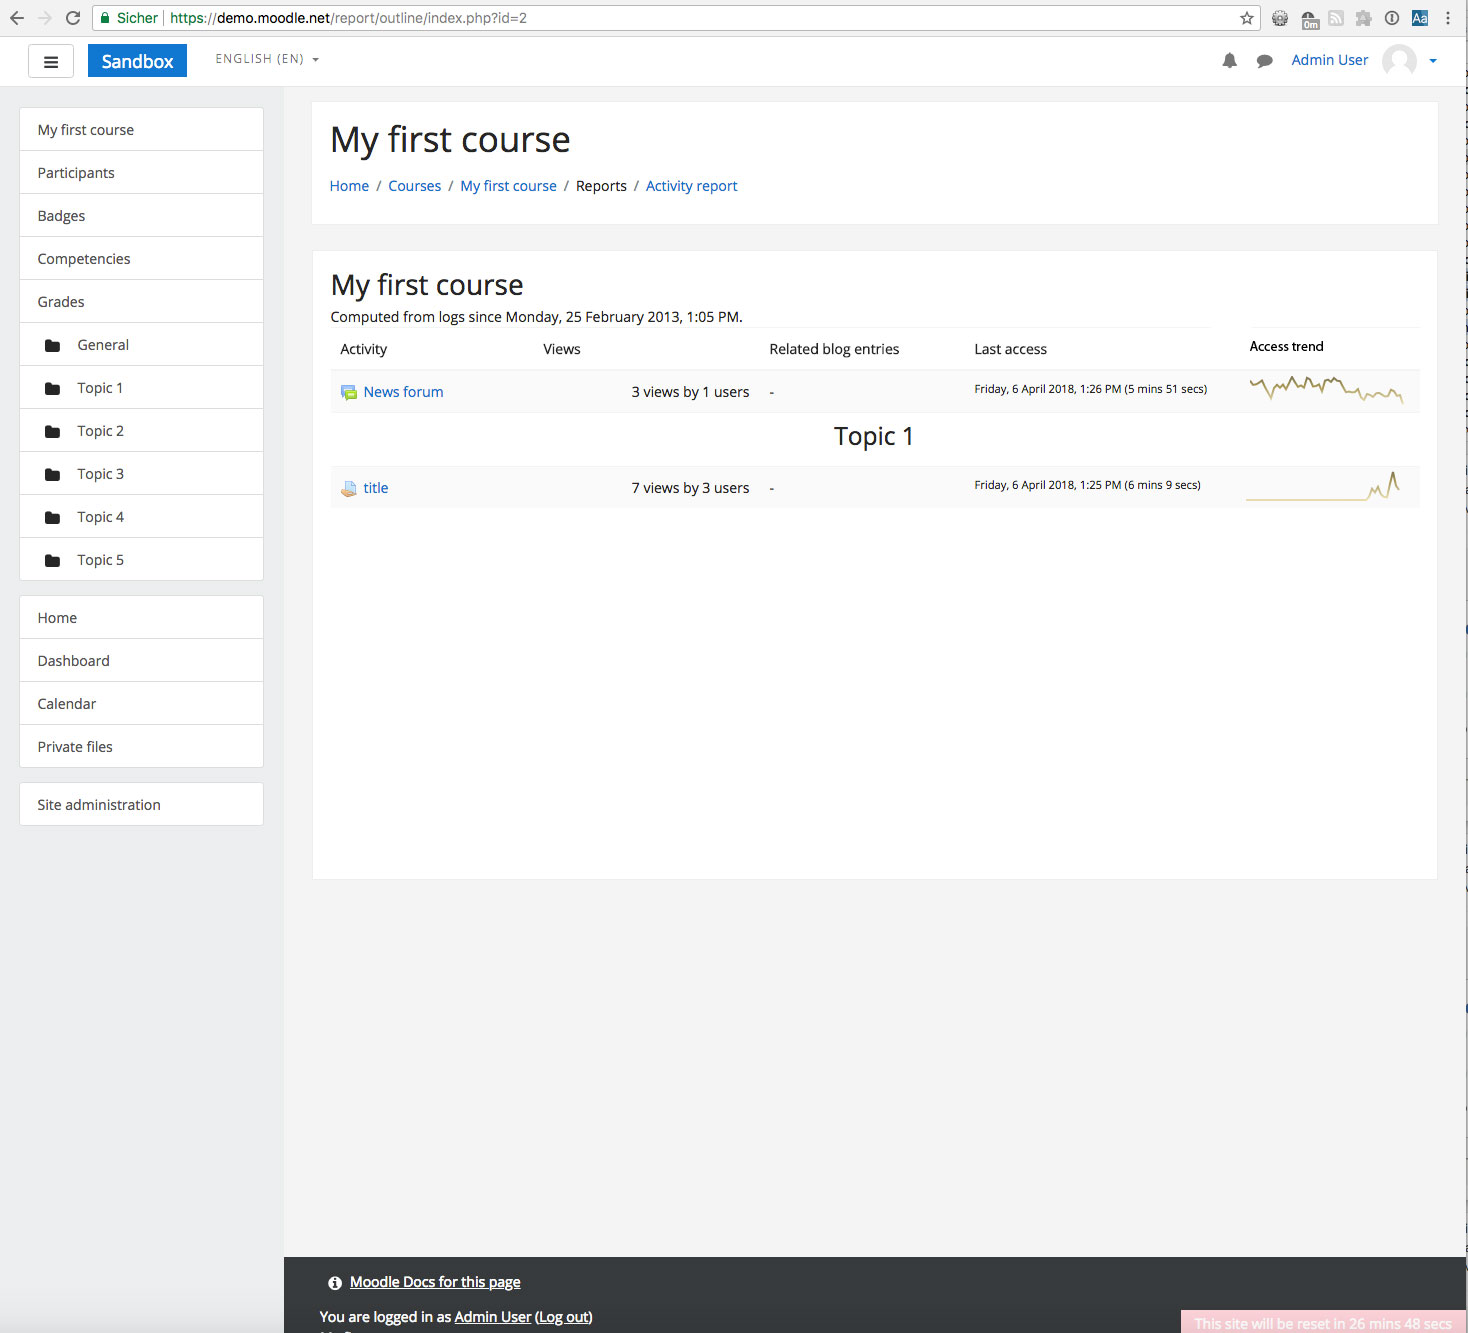
This trend chart could be probably built with https://docs.moodle.org/dev/Charts_API.
