Uploaded image for project: 'Moodle'
  1. Moodle
  2. MDL-56792

New Graph API does not expect HTML in labels

XMLWordPrintable

    • Icon: Bug Bug
    • Resolution: Fixed
    • Icon: Major Major
    • 3.2
    • 3.2
    • Other
    • MOODLE_32_STABLE
    • MOODLE_32_STABLE
    • MDL-56792-master-v2
    • Hide
      FEEDBACK TEST
      1. In a given course with a enrolled student, create a choice module and name it choice.
      2. Create a feedback, with a multi choice question and add the values choice a and choice b.
      3. Log in as student, answer the feedback and log out.
      4. Log in as admin and go to the feedback module > Analysis tab.
      5. Make sure the chart is displayed properly and the labels does not contain any HTML(<a>) code.
      CHART API TEST
      1. Download attached script to your moodle root directory.
      2. Open it in your browser
      3. See attached screenshot with all possible titles/labels on charts (red circles).
      4. Mouse over the bars, make sure the tool tip does not contain any HTML tags.
      5. Make sure all titles and labels does not contain any HTML tags.
      Show
      FEEDBACK TEST In a given course with a enrolled student, create a choice module and name it choice . Create a feedback, with a multi choice question and add the values choice a and choice b . Log in as student, answer the feedback and log out. Log in as admin and go to the feedback module > Analysis tab. Make sure the chart is displayed properly and the labels does not contain any HTML(<a>) code. CHART API TEST Download attached script to your moodle root directory. Open it in your browser See attached screenshot with all possible titles/labels on charts (red circles). Mouse over the bars, make sure the tool tip does not contain any HTML tags. Make sure all titles and labels does not contain any HTML tags.

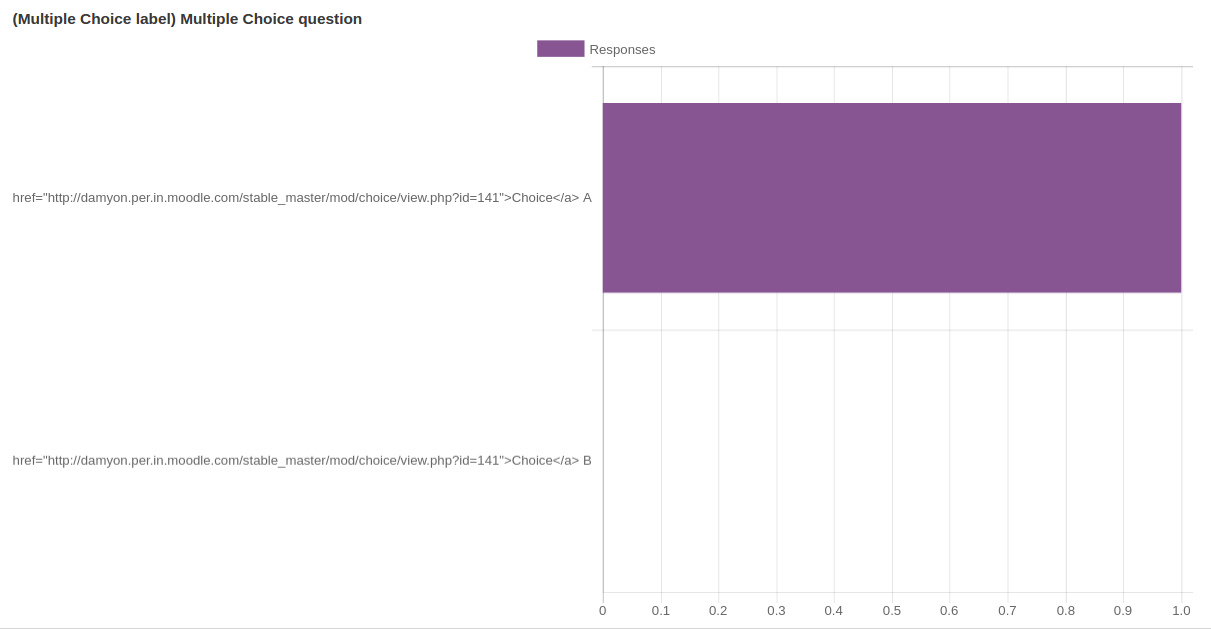
      E.g. create a feedback activity. Add a multi choice question with values "Choice A" and "Choice B". Also add a "choice" activity to the course with the name "Choice".

      Fill out the feedback activity and then view the results ("Analysis" tab).

      What happens - the autoname filter inserts HTML in the labels for the chart and the chart API writes the raw HTML as text.

        1. snap.png
          snap.png
          27 kB
        2. allchartlabels.png
          allchartlabels.png
          48 kB
        3. test_title_labels.php
          0.9 kB

            lameze Simey Lameze
            damyon Damyon Wiese
            cameron1729 cameron1729
            Andrew Lyons Andrew Lyons
            Mark Nelson Mark Nelson
            Votes:
            0 Vote for this issue
            Watchers:
            6 Start watching this issue

              Created:
              Updated:
              Resolved:

                Error rendering 'clockify-timesheets-time-tracking-reports:timer-sidebar'. Please contact your Jira administrators.