• Icon: Sub-task Sub-task
    • Resolution: Fixed
    • Icon: Minor Minor
    • 1.9.1
    • 2.0
    • Quiz
    • None
    • MOODLE_20_STABLE
    • MOODLE_19_STABLE

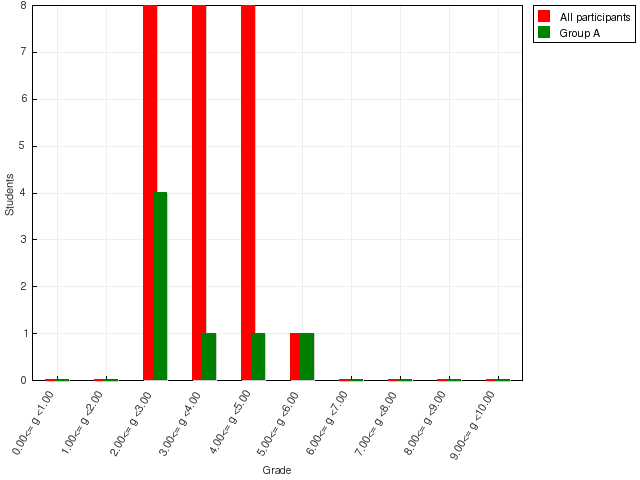
      Our "Early warning test" (see above) generates a graph like this showing score frequencies for all students:

      http://docs.moodle.org/en/Image:Quiz_report_enhancements_historgram.png

      It should be possible to produce a graph like this using graphlib.php, and a single database query, so I think we should, and display it after the results table. It should count the number of attempts with a score in each of an appropriate number of score brackets, depending on the quiz total score.

            jamiesensei Jamie Pratt (Inactive)
            jamiesensei Jamie Pratt (Inactive)
            Jérôme Mouneyrac Jérôme Mouneyrac
            Votes:
            0 Vote for this issue
            Watchers:
            3 Start watching this issue

              Created:
              Updated:
              Resolved:

                Error rendering 'clockify-timesheets-time-tracking-reports:timer-sidebar'. Please contact your Jira administrators.